Economics 854 Midterm
Prof. Bryan Caplan
Spring, 2010
Part 1: True,
False, and Explain
(10 points each - 2
for the right answer, and 8 for the explanation)
State whether each of the following six propositions is true
or false. In 2-3 sentences (and clearly-labeled
diagrams, when helpful),
explain why.
1. Suppose citizens’
willingness to pay to vote (including opportunity cost) in a given election always
equals $50.
T, F, and Explain:
Economic growth will raise voters’
probability of decisiveness.
TRUE. Since voters’ willingness to pay is fixed at
$50, we only need to look at the cost of voting. Since economic growth raises wages – and
therefore the value of time – growth reduces
turnout. Using the probability of
decisiveness formula, lower N implies higher P(decisiveness).
Many students pointed out ways that the benefits of voting would increase – for example, the richer the society, the greater the value of the political spoils. Since I ruled this out by assumption, I only gave such answers partial credit.
2. Suppose half of voters are perfectly informed, and the rest are not. Perfectly-informed voters’ bliss points for defense spending are uniformly distributed between 15% and 25% of GDP. Less-informed voters bliss points are uniformly distributed between 0% and 50% of GDP.
T, F, and Explain:
If the Median Voter Theorem holds, the Miracle of Aggregation ensures
that the median position of the
well-informed will prevail: defense spending will equal 20% of GDP.
FALSE. The medians and means of the two
distributions differ, so the key assumption of the Miracle of Aggregation
fails. The median of the overall
distribution is actually 20.83%>20%.
Contrary to several students, the median of the overall distribution is not the average of the medians of the
two sub-distributions.
3. Suppose free immigration is Kaldor-Hicks efficient but contrary to the interests of the median native voter. People vote selfishly.
T, F, and Explain:
The Mean Voter Theorem implies
that a guest worker program (which allows foreigners to immigrate but not vote)
will be adopted.
TRUE. According to the Mean Voter Theorem,
political bargaining guarantees the efficient outcome, whatever it is. The fact that immigrants can’t vote isn’t a
problem. The people who can vote will simply impose e.g. extra
taxes to ensure that the median voter profits from immigration.
4. Over time, the Democrats have become more popular in the North and less popular in the South.
T, F, and Explain:
Peltzman (“An Economic Interpretation of the History of
Congressional Voting in the Twentieth Century”) accepts the standard “civil
rights” explanation for this trend – but
ignores the possibility that this reflects group-interested voting rather than
self-interested voting.
FALSE. Peltzman’s piece never even mentions civil
rights. His story is that poorer states
are more liberal, exactly as the SIVH predicts.
However, the South is temperamentally more conservative than the North:
Liberalism is a good in the North, but a bad in the South. When the South was poorer, its economic
interests masked its conservative
temperament. As the South got richer
relative to the North, the masking effect got weaker – and the South moved away
from the Democratic party.
Part 2: Short
Essays
(20 points each)
In 6-8 sentences, answer all of the following questions.
1. The GSS question
HELPSICK asks:
In general, some people think that it is the responsibility of the government in Washington to see to it that people have help in paying for doctors and hospital bills; they are at point 1. Others think that these matters are not the responsibility of the federal government and that people should take care of these things themselves; they are at point 5. a. Where would you place yourself on this scale, or haven't you made up your mind on this?
Here are the results
when you regress responses HELPSICK on education, log(real income), self-rated
health (1-4, 1 being healthiest), demographics (males have sex=1, females have
sex=2), and self-rated ideology (1-7, 7 being most conservative). N=12,552.
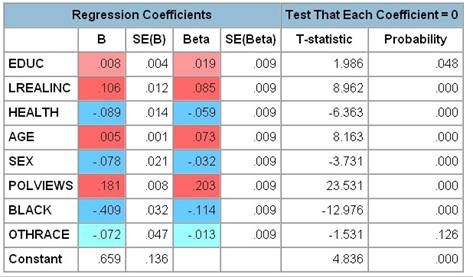
How well do these results fit with all of the main lessons you have learned about voter motivation? Be careful to note any anomalies, and pay attention to absolute magnitudes. Name two additional variables that you would like to see in this regression – and explain why they’re worth adding.
The main lessons we’ve
learned about voter motivation are:
1. Evidence for the SIVH is
very weak.
2. Evidence for
group-interested voting is fairly strong.
3. Apparent effects of income
on policy views are usually education effects in disguise.
4. There is strong evidence
for ideological voting.
How do these results compare?
1. Income and health both
move beliefs in the self-interested direction, but the magnitudes are quite small. On a four-point scale, increasing log income
by one point (a huge change) only moves beliefs by .106. Moving from worst to best health only moves
beliefs by about .27. You could also
argue that age is a proxy for your expected
future health. If you buy this argument,
then it’s striking that age has the wrong sign!
2. If age is a measure of
group interest (e.g. the elderly identify with the elderly), then it’s got the
wrong sign. But the race and sex dummies
have the expected signs, and the coefficient on Black is quite large. This makes sense from a group interest point
of view – even if a black person happens to have high income and good health,
he wants to help the members of his group that aren’t so lucky.
3. Anomaly: Income actually
beats education.
4. Ideology is the single
strongest predictor – moving from most liberal to most conservative changes
beliefs by over a point.
Two additional variables
worth adding: Most obviously, insurance status.
The uninsured have a strongest interest in government support. Other good candidates: Health status of
family members and risky behavior (smoking, drinking, etc.).
2. If drug policy
were left to the states, how would U.S. drug policy change? How would your answer change if governors’
and state legislators’ pay were proportional to property values in their
states? Be sure to identify and discuss
any possible “races to the bottom.”
Policy would clearly become
more diverse: Voters in California feel very differently about marijuana than
voters in Alabama. These changes would
probably increase over time because people would move to states that better
suit their preferences, leading to a sort of “diversity spiral.” One state might even become the “Nevada of
drugs.” If politicians’ pay were based on
property values, this would probably further expand the range of options and
the speed of adjustment – better matching and sorting tends to make everyone’s
property more valuable. You might think
that no one (even drug users) wants to live in a community of drug users, but
in the real world we often see enclaves of “undesirables” clustering
together. It’s very unlikely there would
be a race to the bottom to legalize drugs everywhere – large majorities favor
the status quo. It’s somewhat more
likely there’d be a race to the top – the first community to liberalize might
quickly attract a “bad element” that burdens the rest of the population,
discouraging deviation from the status quo.
3. “Caplan’s and
Gelman’s analyses of the American voter are much more similar than they
initially appear.” Carefully explain why
you agree or disagree.
I agree. On the surface, they directly contradict each
other. Caplan says the SIVH is almost
completely false; Gelman is trying to resuscitate the SIVH by showing that the
state income-vote correlation and the individual income-vote correlations have
opposite signs. On closer look, however,
Gelman’s analysis fits all of Caplan’s main lessons from Weeks 4-6: (a) While
the rich are more Republican, the effect is small, and to a large degree a
proxy for race. (b) There is a big flat
range: Republican voting is constant from 30k to 150k. (c) The strong state-level effects look like
group-interest or ideological voting, not the SIVH. The difference in emphasis probably reflects
their different disciplines: Economists are surprised that the SIVH doesn’t
work well, but political scientists are surprised when the SIVH works at all.
4. Explain and
criticize Bartels’ proposed explanations for the disconnect between public opinion
and government spending. What do you think is the best way to interpret
his results? Propose an empirical test
of your preferred interpretation of the facts.
Bartels
presents three explanations. Here they
are, with my critiques:
1.
Failure of democratic representation – politicians are just ignoring voters. This is implausible; if it were true, why
don’t “big spenders” win elections more consistently?
2.
Fiscal discipline – the public wants fiscal discipline even more than it wants
spending increases. Bartels rejects this
on the grounds that budget-cutting preferences and unmet demand for spending
are negatively correlated. The countries where overall spending cuts are
most popular are the ones where the difference between actual and desired
spending is smallest. But couldn’t this
just reflect ideological heterogeneity between relatively pro- and
anti-government countries?
3. Economic capacity – “Poorer countries obviously have less wherewithal to satisfy citizens’
demands for spending on government programs than richer countries do.” Maybe.
But if you’re willing to say that the budget constraints are “less
salient” to the public than to policymakers, why not consider more radical
theories, like my favorite:
The public’s
preferences are simply contradictory and confused; what many of them want is
not just economically unfeasible but logically impossible.
A test of my
hypothesis: Ask the public about perceived
spending, taxes, deficits, and inflation.
On my theory, better perceived
outcomes will predict more support for incumbents, even when the perceptions
are mutually inconsistent.