Economics 854
Midterm
Prof. Bryan
Caplan
Spring, 2015
Part 1: True,
False, and Explain
(10 points each - 2
for the right answer, and 8 for the explanation)
State whether each of the following six propositions is true
or false. In 2-3 sentences (and
clearly-labeled diagrams,
when helpful), explain why.
1. Suppose rent control makes landlords $2B poorer and tenants $1B richer. A successful campaign to abolish rent control will cost $300M. Every dollar of compensation paid to tenants costs $1.10 to deliver.
T, F, and Explain: Rent
control is Kaldor-Hicks efficient, because full compensation plus all
transaction costs exceed the deadweight cost.
FALSE. K-H efficiency does not require paying
compensation. The only required
social cost of the transition is $300M, for a net social gain of $700M. In fact, since there is a transaction
cost of paying compensation, paying compensation would be K-H inefficient.
2. Voter turnout in school board elections is often below
10%.
T, F, and Explain:
This will not lead to inefficient outcomes if the Mean Voter Theorem is
true, but might if the Miracle of Aggregation is true.
TRUE. The Mean Voter Theorem implies full efficiency. The theorem only holds when transactions costs are zero – and as long as transactions costs are zero, societal outcomes are always efficient. However, the Miracle of Aggregation does not ensure efficient outcomes if informed voters have different preferences than uninformed voters. The informed voters in school elections might all be teachers’ union members who vote to maximize their personal advantages regardless of social effects.
3. T, F, and Explain:
In party identification regressions on modern U.S. data, the signs
on the coefficients on income, gender, and race fit the SIVH.
TRUE. In general, Democrats are lower-income,
less white, and less male, while Republicans are higher-income, more white, and
more male, just as the SIVH predicts.
The problem with the SIVH is magnitudes of the effects. If the SIVH were true, income should be
much more important – both absolutely and relatively – than it is.
Note: I gave full credit for
students who said FALSE, then pointed out specific regressions where the signs
of the coefficients were off. I had
an “in general” proviso in mind, but kudos for the students who
knew the data well enough to point out counter-examples.
4. “Although the
spatial model has an applied use in short-term prediction, its greater
relevance is in what it indicates about long-term changes in our political
system.” (Poole and Rosenthal, “Patterns of Congressional
Voting”)
T, F, and Explain: The main long-term change Poole and Rosenthal find is that the two
major parties became increasingly polarized.
FALSE. Poole and Rosenthal specifically say the
opposite: “[T]he average distance between the parties – and by
inference the average distance between all legislators – has shrunk
considerably in the past 100 years.”
Part 2: Short
Essays
(20 points each)
In 6-8 sentences, answer all of the following questions.
1. Do the SIVH, sociotropic voting, and group-interested voting models make different predictions about voter turnout? If so, how do their predictions differ – and by how much? (Hint: People vote if pB>C, where p is the probability of decisiveness, B is the value difference voters assign to the leading candidates, and C is the cost of voting).
Regardless of your
motivations, the cost of voting C is basically the value of the time it takes
to vote. Selfish voters only
include selfish benefits in B; group-interested voters include selfish benefits
plus benefits for their group; sociotropic voters include selfish benefits plus
benefits for everyone (or at least
all fellow citizens). So holding
turnout constant, selfish voting predicts the lowest turnout, group-interest
intermediate turnout, and sociotropic voting the highest turnout. Probability of decisiveness, p, partly
offsets this effect, but only if turnout does indeed rise.
By how much do the
predictions differ? For realistic
values of p, pB is usually extremely low regardless of voter motivation. If p=![]() , pB remains infinitesimal even if you care about all
7B people on Earth as much as yourself.
However, if there is even a 1% chance of a very close election (a near
50/50 split), increased concern for other people sharply affects turnout.
, pB remains infinitesimal even if you care about all
7B people on Earth as much as yourself.
However, if there is even a 1% chance of a very close election (a near
50/50 split), increased concern for other people sharply affects turnout.
2. In the GSS, the question ABANY asks: “Please tell me whether or not you think it
should be possible for a pregnant woman to obtain a legal abortion if the woman
wants it for any reason?” (1=yes;
2=no)
Here are the results if you regress ABANY on SEX (1=male, 2=female).

Here are the results if you add Biblical literalism (BIBLE), church attendance (ATTEND), and ideology (POLVIEWS) as control variables.
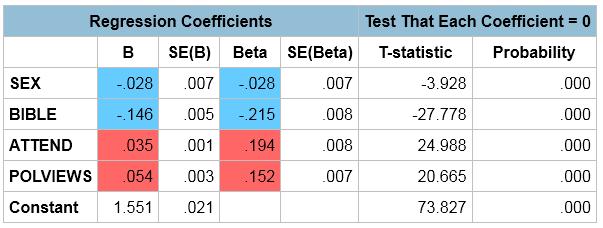
Why is the change in the coefficient on gender noteworthy? Do the results strengthen or weaken the view that ideas are largely a mask for self-interest? For group interest?
The change is noteworthy because
the unadjusted result – women are more pro-life – contradicts the
SIVH (and group-interest), while the unadjusted result – women are more
pro-choice – fits the SIVH (and group-interest). The effects are tiny in both cases, but
at least in the second regression the coefficient on SEX does not directly
contradict the SIVH.
These results weaken the view that ideas are largely a mask for self-interest or group-interest. On the mask theory, people conveniently adopt the ideas that serve their self & group interests. As a result, the adjusted coefficients on SEX should match self & group interests worse than the unadjusted coefficients. In fact, however, the adjusted coefficients on SEX match self & group interests better than the unadjusted coefficients. Apparently women tend to adopt pro-life ideas despite their interests, not because of them.
3. Suppose Virginians vote ideologically but non-Virginians vote selfishly. Everyone, however, chooses their state of residence selfishly. If the Tiebout model is true, what will happen to the tax policies and demographics of the state of Virginia? Justify your answer.
By U.S. standards, Virginia now has relatively small
government, low taxes, and high economic freedom. If the assumptions of this problem were
true, this would lead to two main effects:
1. Relatively poor Virginians would leave the state.
2. Relatively rich non-Virginians would move to the
state.
The native Virginians who remain would, on average,
continue to support the status quo.
After all, they stayed in Virginia for selfish not ideological
reasons. The new arrivals to
Virginia, however, would selfishly favor the policies they moved to enjoy. Soon they would greatly outnumber the
native Virginians – and continue to vote for the policy package that
attracted them in the first place.
This does NOT mean, however, that Virginian policy would become more
extreme over time. The new arrivals
would selfishly favor moderately small government, not extremely small
government. However, once people
who benefit from redistribution leave the state, the taxes required to sustain
the same level of redistribution would fall further, leading to the appearance
of further moves in a small-government direction.
4. How might Gelman et al. (“Rich State, Poor State, Red State, Blue State”) say critique Peltzman (“An Economic Interpretation of the History of Congressional Voting in the Twentieth Century”)? Be specific.
Gelman et al. would begin by
pointing out that individual data would have been more informative than the
Congressional voting data that Peltzman uses. But they would go on to criticize
Peltzman’s claim that as income has risen, the North and South have voted
more for their divergent liberal/conservative preferences and less for economic
interests. Individual-level data
show that rising income makes people more Republican and less Democratic in all states, with the magnitude of the
effect being largest in poor states and smallest in rich states. Gelman et al. would however appreciate
Peltzman’s attention to state-specific effects, because it partly
foreshadows their own work.