Prof.
Bryan Caplan
bcaplan@gmu.edu
http://www.bcaplan.com
Econ
854
Week 6: Voter Motivation, III: Miscellaneous
I.
Religion, Party, and Ideology
A.
Many observers of modern American politics think that the divide
between secular and religious voters matters. Does it?
B.
The General Social Survey has measures of religious belief (especially
Biblical literalism) and religious practice (especially church
attendance). N≈26,000.
Bible goes from 1-4, 1 being most literalist; ATTEND goes from 1-7, 7
being most frequent.
C.
First,
let’s add these measures to the initial linear probability models from
Week 4. (Tables 8a&8b)
D.
Results: Both measures have substantial but not overwhelming predictive
power, especially for Republicans.
E.
What about religion and ideology?
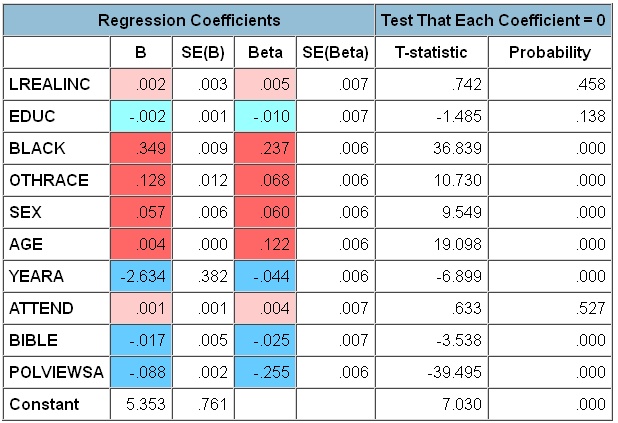
Table 9 shows that our two religious measures are by far the strongest
predictors of ideology. If the
liberal-conservative divide is “really” something else, it’s
a secular-religious divide.
F.
Note, however, that the magnitudes are still not huge. The ideology variable goes from -3 to
+3, but moving from the minimum to the maximum on the religious variables only
makes you 1.32 units more conservative.
G.
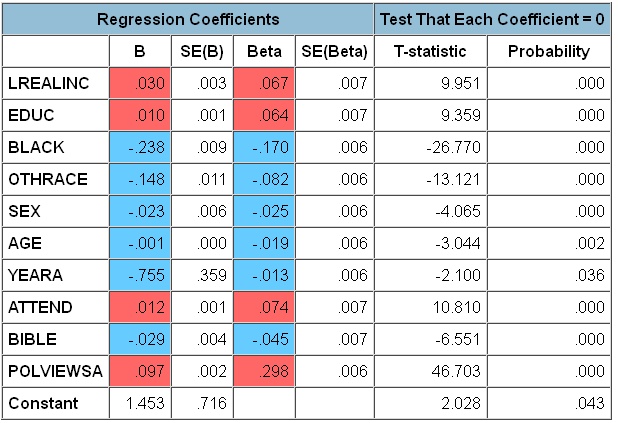
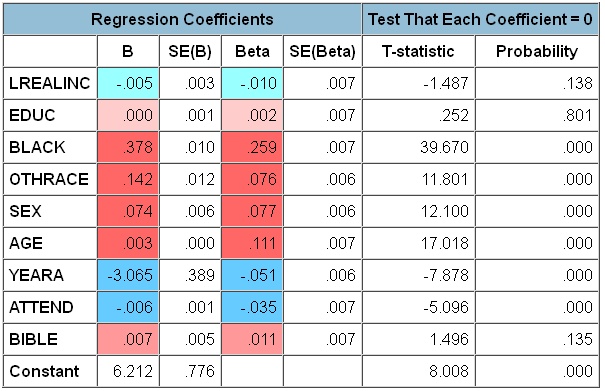
What if we race ideology against religion as a determinant of party
identification? Ideology still
crushes religion, especially for P(Dem). (Tables 10a and 10b)
II.
Personality and Ideology
A.
The Five Factor Model now reigns supreme in personality
psychology. Acronym: OCEAN. (Myers-Briggs analogs in parenthesis).
1.
Openness to Experience (Intuitive vs. Sensing)
2.
Conscientiousness (Judging vs. Perceiving)
3.
Extraversion (Extraverted vs. Introverted)
4.
Agreeableness (Feeling vs. Thinking)
5.
Neuroticism (No MB analog, but the negative of Neuroticism is
Stability)
B.
Despite economists’ incredulity, personality measures are predictively
useful. Ex: Occupational choice.
C.
Especially given the low MC of voting one way or another, it seems
plausible that personality would have large effects on political views. Do they?
D.
Data sets with personality and political info are scarce, but some
serious results are now in. Gerber
et al summarize past findings, and present some new ones.
E.
Robust past findings: Conservatives are lower in Openness and higher in
Conscientiousness. Lower Openness
and Higher Conscientiousness predict higher conservatism for almost all
measures; higher Stability predicts higher conservatism for most but not all
measures. (Table 4)
F.
Magnitudes in Gerber et al’s data: Personality variables go from
0-1, ideology goes from 1-5. So
going from the minimum to the maximum level of Openness makes people about a
point less conservative, and going from the minimum to the maximum level of
Conscientiousness makes people about half a point more conservative.
G.
Gerber et al distinguish economic and social ideology (scaled to have
mean=0 and SD=1) and find additional patterns, even controlling for education
and church attendance. (Table 6 and Figure 1)
H.
The robust predictors of social conservatism, like overall
conservatism, are Openness (-), and Conscientiousness (+).
I.
The robust predictors of economic conservatism are: Extraversion (+),
Agreeableness (-), Conscientiousness (+), Stability (+), and Openness (-). Free-marketeers are closed, conscientious,
disagreeable, emotionally stable extraverts.
J.
Interpretation? Two they consider, and one they
don’t:
1.
Some
personalities are less self-interested than others.
2.
Some
personalities have different interests than others.
3.
Some
personalities see the world more clearly than others.
K.
Compared to other
predictors of
ideology, these are strong. But in
absolute terms, ideology remains hard to predict.
III.
Genes and Political Behavior
A.
Political attitudes and behavior often seem to run in families. Why is this?
B.
People usually assume it’s nurture, but in most families, there
is a confounding variable: genes.
C.
How can we distinguish the effects of nature and nurture? There are two standard “behavioral
genetic” approaches:
1.
Twin studies
2.
Adoption studies
D.
Adoption studies are still fairly unexplored for political attitudes
and behavior, but quite a few twin studies exist.
E.
Main findings: Nurture matters a lot for party identification.
F.
However, genes account for most or all of the family resemblance in:
1.
Whether you vote
2.
Whether you always vote for one party
3.
Issue positions (and a wide range have been studied!)
4.
Left-right ideology
G.
There are strong parallels between the behavior genetic results for
religion and politics. Religious affiliation is strongly influenced by
parents, but by mid-adulthood, genes explain most or all familiar resemblance
in:
1.
Church attendance
2.
Religious intensity (how religious you feel, how interested you are)
3.
Doctrinal views
IV.
Mainstream and Polarization Effects
A.
There are interesting empirical connections between political awareness
and opinion. Political scientists
call these the "mainstream" and "polarization" effects.
(Zaller 1992)
B.
The "mainstream" effect: When elite opinion is united,
agreement with elite opinion is an increasing function of political awareness.
C.
Interpretation: For non-partisan issues, the more aware you are, the
more likely you are to know what everyone is "supposed to believe."
D.
The "polarization" effect: When elite opinion is divided
along ideological lines, agreement with "your" ideological leaders is
an increasing function of political awareness.
E.
Interpretation: For partisan issues, the more aware you are, the more
likely you are to know what people on your side of the fence are "supposed
to believe."
1.
Ex: Nixon on price controls.
F.
Contrast: The Vietnam War in 1964 versus 1970.
G.
Limits of the mainstream effect: at least under censorship,
susceptibility to propaganda peaks at around the 67th percentile of
awareness, then declines. It takes
some sophistication even to be brain-washed!
H.
Note: We could also think of the mainstream and polarization effects as
“leadership” effects.
VI.
Does Policy Match Public Opinion?
What Are the Unpopular Policies?
A.
Now that we have a better grip on voter motivation, let us return to
the earlier question: Is the median voter model correct?
B.
It is hard to do formal empirical tests on the federal government
(without internationally comparable data, N=1). But there is a lot of informal evidence
that the median voter gets what he wants.
C.
What does the federal government do? Is this what the median voter
wants?
1.
Spending (2015)
|
Source |
Share |
|
Social
Security |
23.9% |
|
Defense |
15.8% |
|
Domestic
Discretionary |
15.8% |
|
Medicare |
17.2% |
|
Net
Interest |
6.1% |
|
Income
Security |
8.2% |
|
Medicaid |
9.5% |
|
Other
Retirement/Disability |
4.4% |
|
Other |
6.1% |
|
Offsetting
receipts |
-7.0% |
2.
Taxes (2015)
|
Source |
Share |
|
Individual
Income Taxes |
47.4% |
|
Payroll
Taxes |
32.8% |
|
Corporate
Income Taxes |
10.6% |
|
Excise
Taxes/Customs |
4.1% |
|
Other |
5.1% |
3.
A lot of regulation: Environmental, worker safety, drug safety,
anti-competitive behavior, labor...
D.
Starting with the budget: Social Security and Medicare remain extremely
popular programs; the military is also usually well-regarded. The remaining items are more
contentious.
E.
Broadly defining "welfare" as Medicaid and Income Security,
we get 17.7% of the budget. But:
1.
Few people want to actually abolish these programs
2.
Medicaid also pays for middle-class nursing home residents who have
depleted their personal savings.
F.
The national debt is unpopular, but repudiating it would be even less
popular. So "net
interest" ultimately has voter support.
G.
That leaves 22% of the budget for "domestic discretionary"
and "other" spending.
Some of this spending is "waste.” Waste is unpopular. But outside of isolated examples of $500
toilet seats, what spending do a majority of Americans agree is wasteful?
H.
Turning to spending: It is surprising that income and SS taxes are such
a large percentage of the budget.
But insofar as business "passes on" corporate and other taxes,
do a majority of Americans really want significant changes here?
I.
Regulation is more complicated.
Are there majorities in favor of weaker (or stronger) environmental regulation? Worker safety? Drugs?
J.
Challenge: What
policies exist that a majority of American voters oppose? Consider all the clichés of
politics. Do any hold water?
1.
Relatively weak
gun control?
2.
Foreign aid?
3.
NAFTA?
VII.
Application: State-Level Policy
A.
There have been a number of empirical studies of state-level policy.
B.
Main findings: Variations in degree of liberalism are strong predictors
of variation in state policy. When
public opinion is liberal (as in NY), policy is liberal; when public opinion is
conservative (as in
C. It is hard to convincingly show that public opinion and policy match each other 1:1, but the evidence is suggestive.
VIII.
Bartels’
Case that Government Is Too Small
A.
In the
GSS, the median voter wants to spend
more in most areas. The only area
where the median voter consistently favors cuts is foreign aid.
B.
Larry Bartels
generalizes this finding to all 23 of the countries he looked at:
“Citizens in every country in every year wanted additional government
spending on health, education, old age pensions, the environment, and law
enforcement.”
C.
Both the
GSS and Bartels’ data also show, however, that voters around the world
want less spending overall! “The distribution of responses to
this question is, if anything, even more skewed than for the questions in the
battery on spending for specific government programs. Averaging across
countries and years, about two-thirds of the respondents said they favored cuts
in government spending, many ‘strongly’; only 10% were
opposed.”
D.
It is
well-known that adding a warning about the connection between higher spending
and higher taxes depresses support for spending.
E.
GSS
spending preference data doesn’t have such a warning. Bartels’ data does, but it’s
weird: “Remember that if you say "much more," it might require
a tax increase to pay for it.”
Problems:
1. It suggests that moderate spending increases don't require higher taxes.
2. It fails to mention that spending cuts would reduce taxes.
F. When the GSS gives a binary choice between higher spending on “social programs like health care, social security, and unemployment benefits” or lower taxes, 60% want higher spending. But adding a status quo category would almost certainly show that the median person favors the status quo over change in either direction.
G. Overall: Since voters’ stated budgetary preferences are contradictory, it is hard to tell if they are “getting what they want.” But the contradictions are weaker for better questions, which generally show that the median voter favors the status quo.
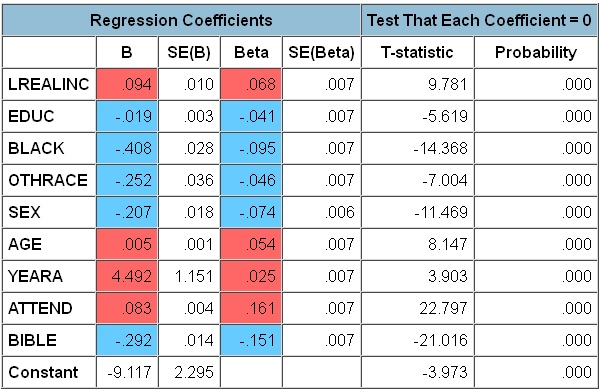
Table
8a: Conditional Probability of Being a Democrat, with Literalism and Attendance
Table
8b: Conditional Probability of Being a Republican, with Literalism and
Attendance
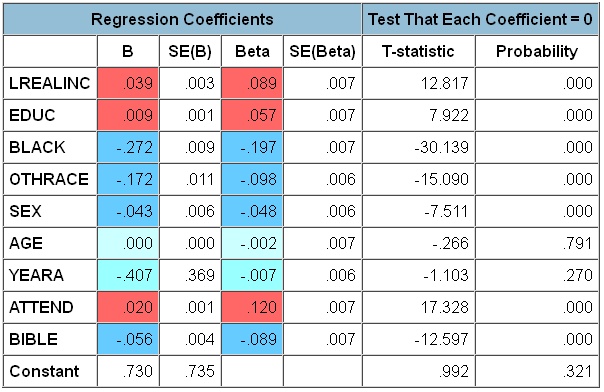
Table 9: Determinants of Ideology, with Literalism and
Attendance