This webpage is created by Daniel Klein for the purpose of providing background information about the Autumn 2013 survey, designed and conducted by Klein, William L. Davis, and Jason Briggeman, used in the Klein-Davis piece.
Here is the text from the Klein-Davis piece, regarding the survey:
It so happens that we surveyed American economics professors in 2013, asking them whether they favored a similar reform. Specifically, we asked whether the following change would be an improvement over the status quo:
"That the United States adopt a policy wherein the FDA selects five of the drug-approval agencies of other leading [Organization for Economic Cooperation and Development] countries (for example, the Health Canada agency in Canada), and then, thereafter, as soon as a new drug is approved by any of those five agencies, that drug automatically gains approval in the United States.”
Of the 467 economists who answered the question and did not mark “Have no opinion,” 53 percent agreed that the reform would be an improvement, while 29 percent disagreed. (The remainder said they were "neutral.") Moreover, those favoring the reform were more likely to say they held their belief "strongly." Hence, the balance of economist judgment certainly leaned in favor of the liberalization.
The FDA question as stated above appeared in five variant instruments. The five instruments are provided here (each is a pdf file):
Instrument Form 1
Instrument Form 2
Instrument Form 3
Instrument Form 4
Instrument Form 5 (does not contain the “ought” or "normative" FDA question used in the piece)
Instrument Form 6
The FDA issue was incidental to the larger goal of the survey project. The larger goal was to explore the relationship between “positive” and “normative” statements. The surveys asked economics professors varying “is” or “positive” questions as well as the singular corresponding “ought” or “normative” questions. The intention was to show that “normative” questions are practically the same as “on the whole” “positive” questions.
The data on economists’ opinion about FDA liberalization is by-product of our larger goal. It is a coincidence that an example we created happens to be pertinent to the Cruz-Lee FDA bill.
The FDA “ought to favor” question, used in Instruments 1-4 & 6 and used in the op-ed, obtained the following results:
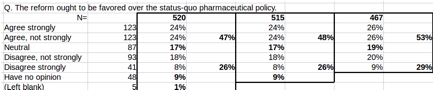
In the piece we exclude “Have no opinion” and (Left blank), using the 467 respondents shown in the box at right.
The respondents for this survey were economics professors at top 300 ranked economics departments of American colleges and universities. To determine a department ranking we relied on a variety of sources, including Tom Coupe’s rankings (undated), which we supplemented with rankings by Grijalva and Nowell (2008). Together, those sources accounted for the top 141 departments. We used Christian Zimmerman’s list of rankings (link) for the additional 159 top rated economics departments, rounding out the top 300.
The mailing list, the mailing, and the receiving of completed surveys were direct by William Davis at the University of Tennessee, Martin. Using the websites of each of the departments, we generated a random mailing list of 3000 individual professors (tenure-track, assistant to full professors, excluding emeriti). The number of recipients selected from each department was based on its size (i.e. number of tenure-track and tenured professors). The mailing list is original and not based on association mailing lists.
The surveys were mailed on September 23rd, 2013 via the U.S. Postal Service (and a reminder postcard approximately four weeks thereafter). Each respondent was provided with a postage-paid return envelope. During the next eight weeks a total of 574 surveys were returned by respondents to William L. Davis at the University of Tennessee at Martin, which funded the survey. After adjusting for 26 P.O. returns, the response rate was calculated to be 19.3 percent (574 surveys completed and returned/2974 surveys delivered).
The following table shows our mailings and responses to each of the six instruments.
|
Form |
“positive” |
“normative” |
Surveys sent out |
Completed surveys |
Core forms |
F1 |
“positive net economic consequences” |
Included |
600 |
111 |
F2 |
“positive net consequences” |
Included |
600 |
117 |
|
F3 |
“increase social welfare” |
Included |
600 |
109 |
|
F4 |
“be good” |
Included |
600 |
120 |
|
Auxiliary |
F5 |
“positive net economic consequences” |
Not included |
300 |
54 |
F6 |
NONE |
Included |
300 |
63 |
|
|
Total |
NA |
NA |
3000 |
574 |
Overall response rate: 19.3 percent (=574/2974) [The denominator is 2974 rather than 3000 because there were 26 PO Returns.]
The Autum-2013 survey described here was conduct using methods (and funding) very similar to a 2010 survey conducted by William L. Davis, in collaboration with Daniel Klein; information about that survey and the articles based on it are found here.
If you have any questions, please contact Dan Klein at dklein@gmu.edu.
References
Coupe Tom. Undated. Revealed Performance: World Wide Rankings of Economics Departments and Economists: 1969-2000. Mimeo, ECARES. Universite Libre de Bruxelles.
Grijalva, Therese and Clifford Nowell. 2008. A Guide to Graduate Study in Economics: Ranking Economics Departments by Fields of Expertise. Southern Economic Journal. 74(4): 971-996.